 One of the common problems we programmers face (and hopefully we are aware of) are memory leaks, or leaks of any other kind of resources. For example, Windows limit the number of GDI or USER32 objects that a process can allocate at one time. When things go down the wrong road you would want to have the tools to help you find (again) the correct path to free-what-you-create.
Some IDEs have built-in leak detection capabilities. MS’s Visual Studio has recently got a tool to show a list of memory blocks allocated from a heap. Sad to say, but not only the memory allocated from a heap can leak, but also the memory allocated by COM / ActiveX, and virtual memory, and file mapping views, and many others. Unfortunately leaks of handles, GDI and USER32 resources are not detected at all by Visual Studio (Deleaker, on the other hand, detects all kinds of leaks and can work in Visual Studio as well).
RAD Studio does not have such a built-in tools. It would be great if during debugging you could just click on the “magic” button and review where and by what code the memory, files and other descriptors, objects were allocated.
Deleaker
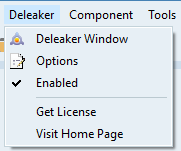
Recently such an extension, Deleaker, which can do all this and much more, has been released. Initially, Deleaker was created as an extension for Visual Studio, but this year it began to support other IDEs, including RAD Studio and Qt Creator.
You can download Deleaker here: https://www.deleaker.com/download.html
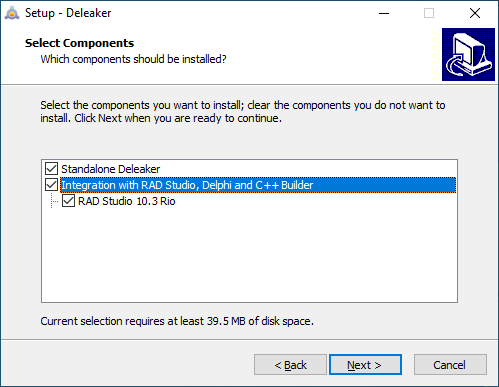
The installer suggests adding Deleaker to the versions of RAD Studio installed on the machine:
For a quick test, let’s create a simple Windows VCL application and add a memory leak to it:
procedure TForm1.FormCreate(Sender: TObject);
var
  stringList: TStringList;
begin
  stringList := TStringList.Create;
end;
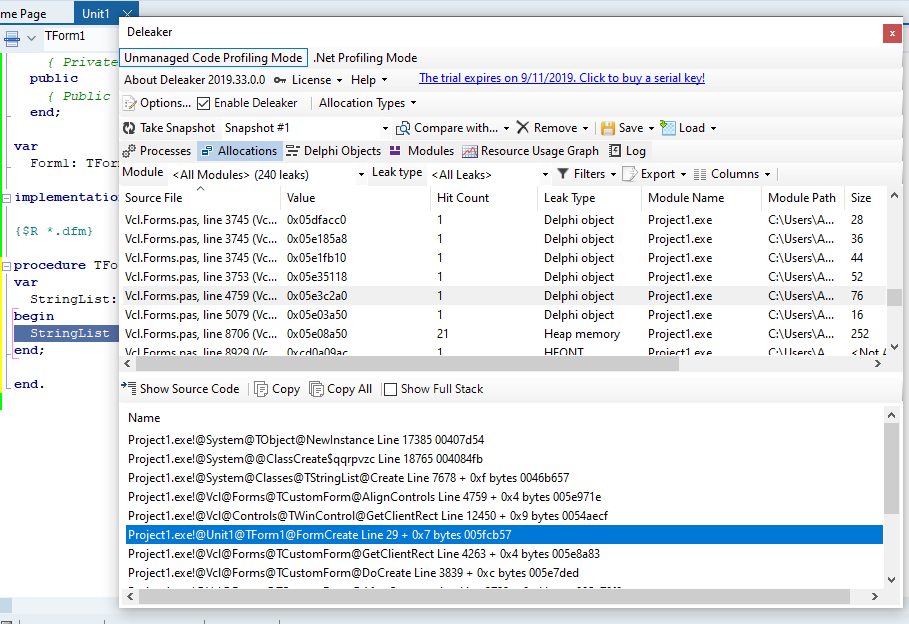
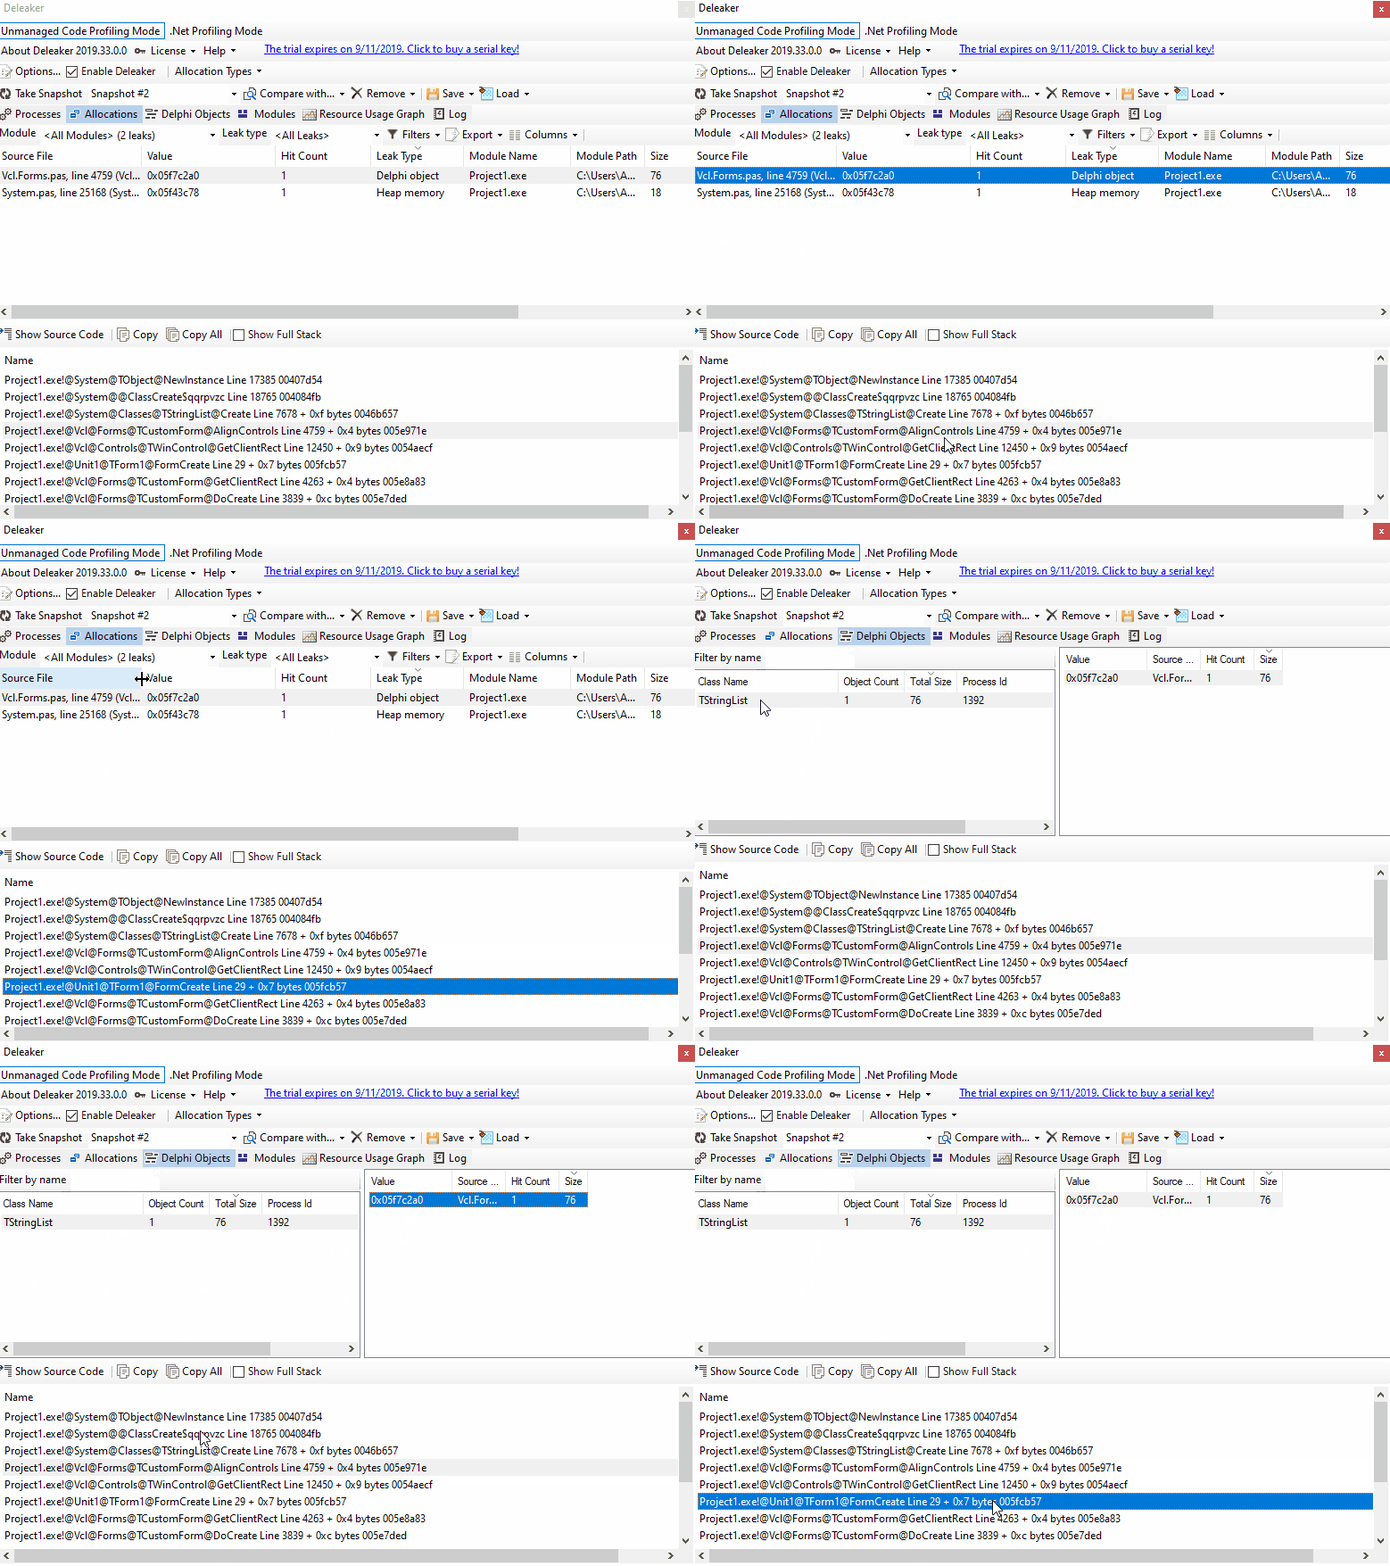
Then build and run in debug mode (it is important to run it in debug mode). Return to RAD Studio, find the Deleaker menu item, select Deleaker Window. In the window that appears, click on Take Snapshot to get a list of all current allocations. Among them is our TStringList object. You can explore the call stack:
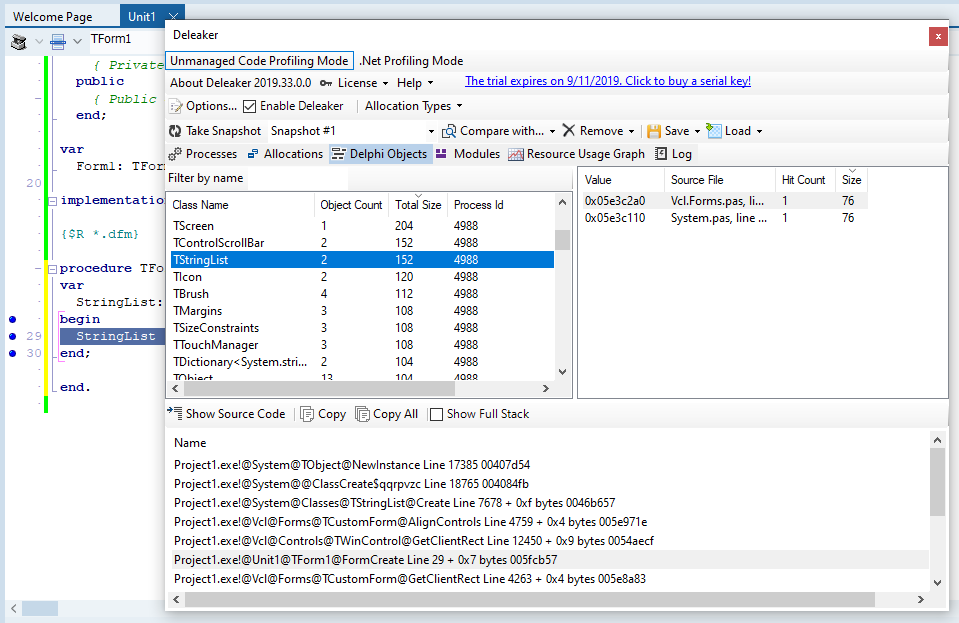
If you switch to the Delphi Objects tab, then there you can see a list of objects grouped by class:
Close the application window to quit the process. Immediately Deleaker starts taking a snapshot, which is needed in order to explore which pieces of memory, which objects and other resources have not been freed:
Another useful feature is comparing two snapshots. For example, a developer realizes that a process constantly consumes memory and does not give it back, or the number of GDI objects increases and increases. One could just get a snapshot and explore it, but it is much more convenient to get the first (base) snapshot, then give the process some time to allocate new resources. Finally get a new snapshot and look at its difference with the base snapshot.
For example, let’s add a timer and every half second it will create a new object and also opens a file:
procedure TForm1.Timer1Timer(Sender: TObject);
var
  StringList: TStringList;
begin
  StringList := TStringList.Create;
  CreateFile('1.tmp', GENERIC_READ, FILE_SHARE_READ or FILE_SHARE_DELETE, nil, CREATE_ALWAYS, 0, 0);
  DeleteFile('1.tmp');
end;
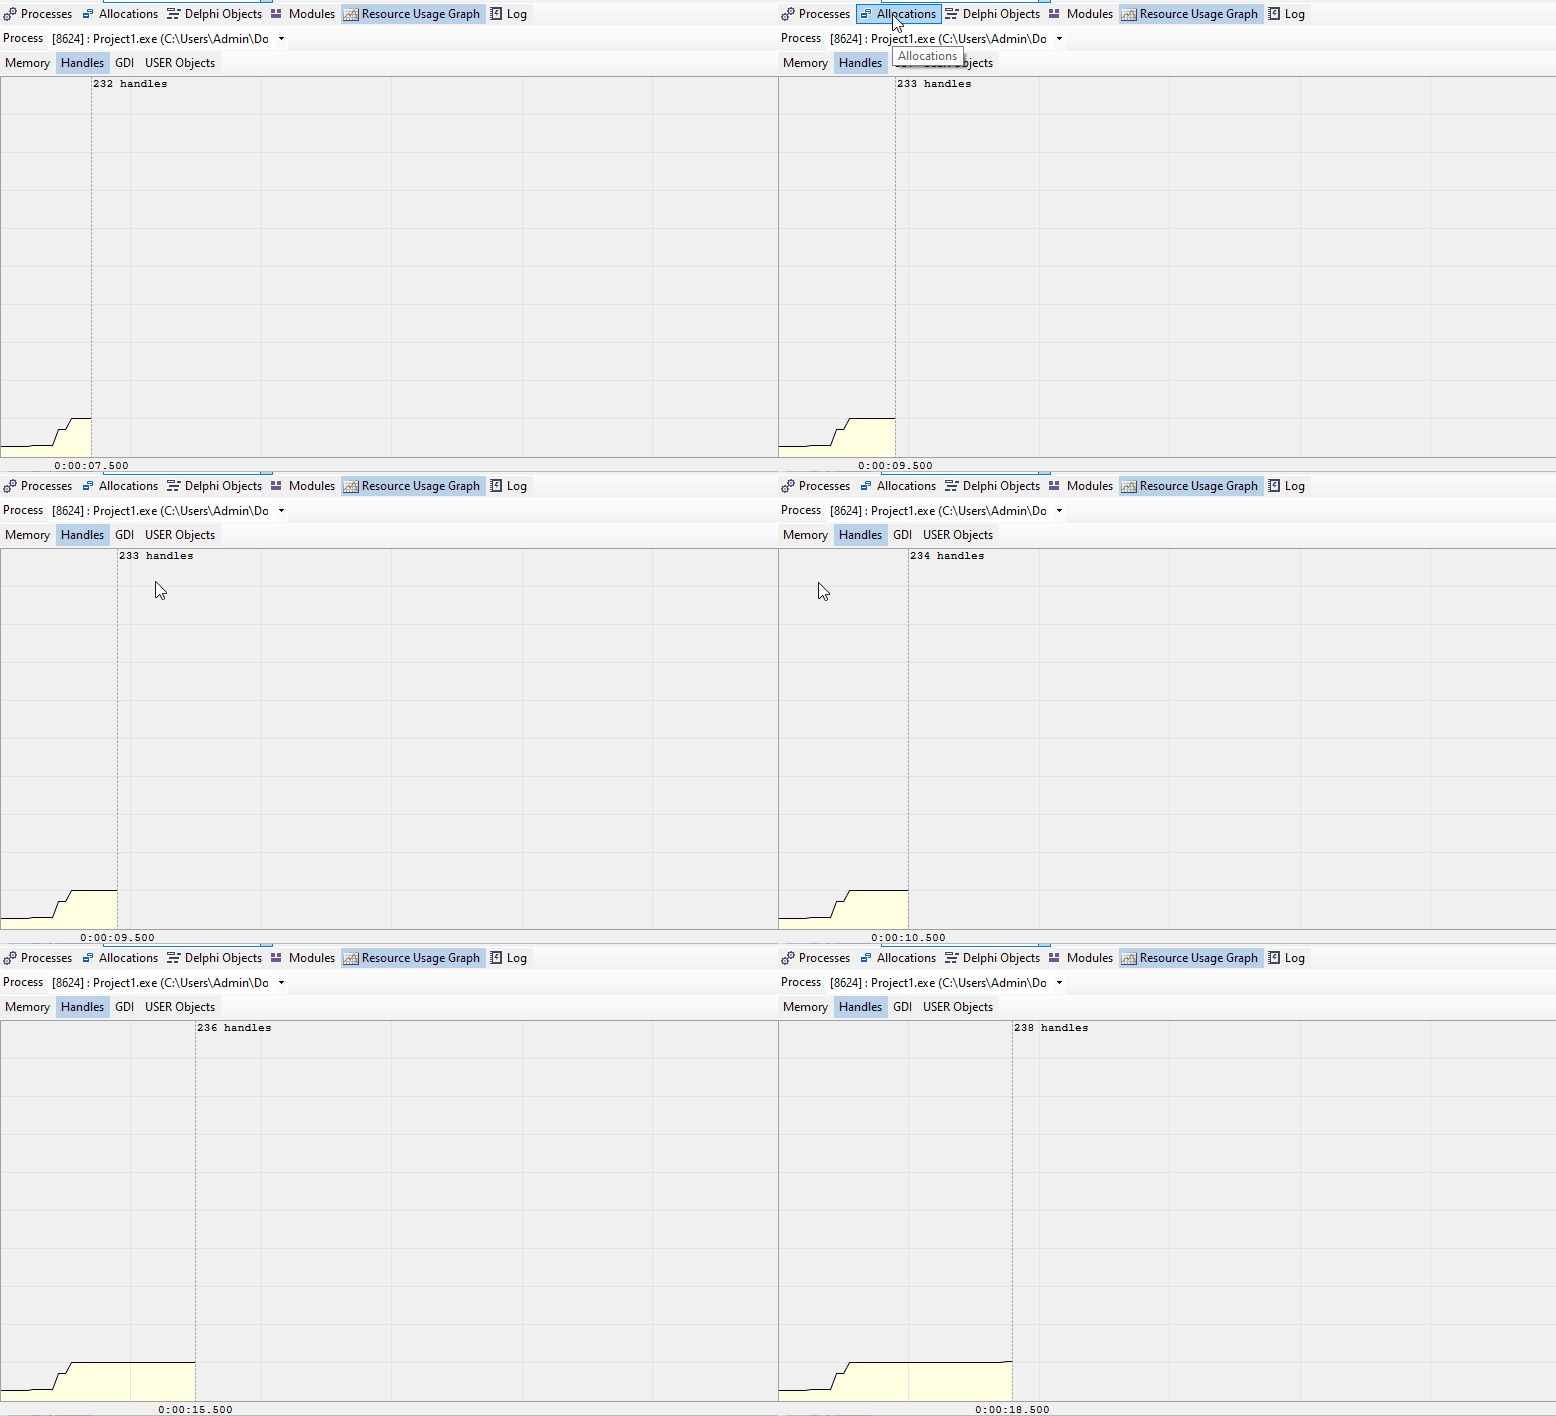
Start debugging, switch to Deleaker. You can see how resources are allocated on a graph:
Let’s take two snapshots, select the first one, then click Compare with… to see the difference, namely the resources that have been allocated since the first snapshot was taken:
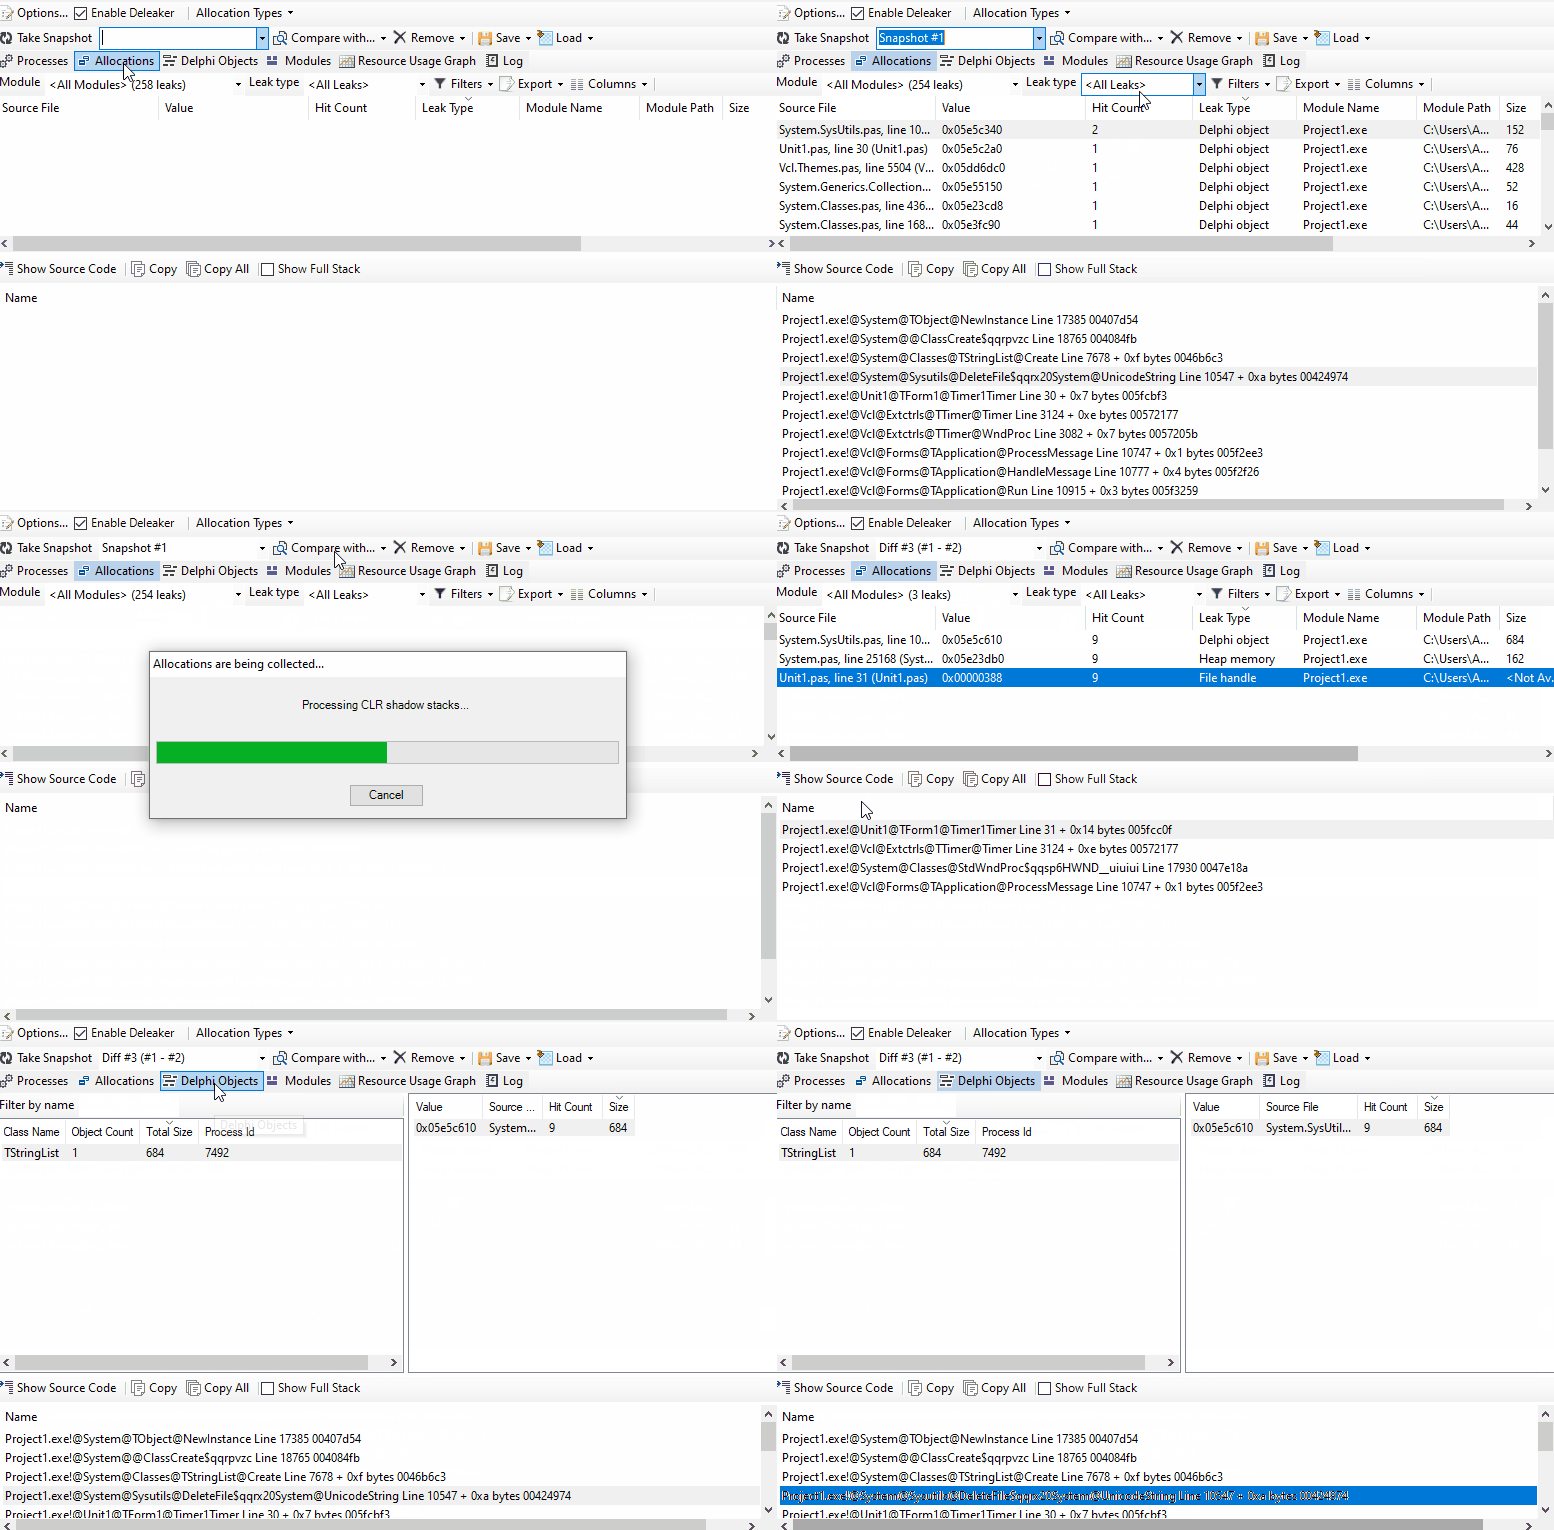
Thus, the difference between snapshots allows to see new allocations, and of great importance is the number of Hit Count that indicates that they are allocated at the same place in the code.
All in all, a nice piece of work by Artem Razin (developer behind Deleaker and CEO of Softanics).
Now, when it comes to memory wasting issues I’m an old fan of madExcept and FASTMM. I’ve been using those for ages to fight against memory leaks.
By a quick look, Deleaker is a useful extension for exploring memory and other resources, as well as for finding leaks. You can review either a specific allocation or even an individual object, and for each a call stack is available, so it’s easy to find where a particular object, or memory, is allocated. Give it a try.

I have also tried Deleaker and found it severely lacking. It didn’t find any of the memory leaks I specifically inroduced for the purpose of testing. Also, the UI is confusing and support does not exist. Sorry, no cookie.
I use Deleaker for my Delphi projects as well. It is an excellent product and the author is always very responsive to any issues.
Thank you for this article! It is very much appreciated!
Hi,
Does it work for android firemonkey (in RAD Studio) too?